
Śląskie SMOGSTOP
by Instytut Ekologii Terenów Uprzemysłowionych
Features Śląskie SMOGSTOP
The Śląskie SMOGSTOP application was created in partnership with the Silesian Voivodeship with the Institute for Ecology of Industrial Areas and the Silesian Center for Heart Diseases.
It is part of the InfoSMOG-MED informational and educational project, which aims to make the inhabitants of Silesia aware of the health risks posed by air pollution.
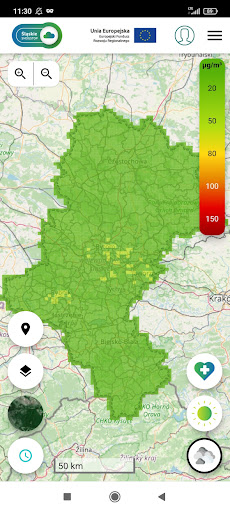
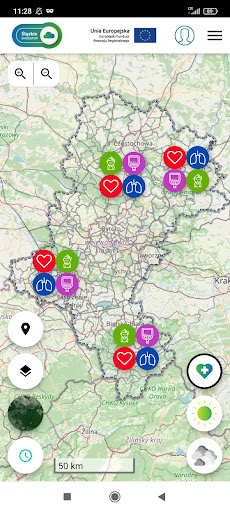
In addition, it provides information on the forecasted data on air quality in the Śląskie Voivodeship and health risks in 4 categories: cardiovascular, pulmonary, pediatric and diabetic.Air quality forecasting systemThe air quality forecast modeling system provides numerical values for hourly concentrations of SO2, NO2, CO, PM10 and PM2.5 dusts and the air quality index.The system includes the following elements:MFF meteorological forecast modelEmission modelCALPUFF contamination spread modelAir pollution concentration forecast modelThe air quality forecasting system is based on its own meteorological forecast carried out with the use of the WRF model in a 2-kilometer grid.
The meteorological forecast is based on the NOAA global forecast and is detailed in the following domains: national and for the province.
Silesian.
Forecasts in the WRF model are corrected based on METAR messages from airports located in Poland and neighboring countries.
Temperature, pressure, wind direction and speed forecasts are generated twice a day at 6:00 am and 6:00 pm for the next 48 hours.
The forecasted values of these meteorological parameters are presented on the map in a 2kmx2km grid and in points for the indicated location in the form of a graph and a table.The emission model takes into account emissions of pollutants into the air from point sources, municipal sources and road transport.
Point emission includes emission from high industrial emitters.
The emission data comes from the KOBIZE database from 2018.The municipal emission is determined in the model on the basis of forecast air temperatures and technical data of buildings regarding thermal insulation and the structure of heat sources used to heat residential buildings.
The amount of emission is determined for each hour, taking into account the heat demand at a given outside air temperature, and the emission is averaged for the area of residential buildings with a given square of the calculation grid.In the power supply system of the emission model, the linear emissions from road transport are based on the General Road Traffic Measurement of 2015.
The traffic volume on the road sections not covered by this measurement (poviat and commune roads, as well as voivodeship and national roads in urban poviats) was adopted according to data obtained from communes and poviats.
The emission takes into account the periodic variability of traffic intensity (daily, weekly and seasonal).Forecasts of the concentration of air pollutants such as PM10, PM2.5, SO2, NOx and the air pollution index are presented on the map in a 2kmx2km grid and in points for the selected location in the form of a graph or table.
These data are updated twice a day at 6:00 am and 6:00 pm for the next 48 hours.The application allows the user to log in and select the type and form of receiving notifications about forecasted exceedances of air pollutants and health messages.On the basis of the air quality forecast, messages about health threats are generated in the system.
The innovation of this system is the generation of personalized health messages for users with specific pulmonary, diabetic, cardiovascular and pediatric conditions.
The logged in user can receive individual messages for his location in the form of push or e-mail.
Weather Features
Get accurate weather forecasts and real-time updates.
Fitness Tracking
Track your workouts and monitor your health metrics.
Learning Tools
Enhance your learning experience with interactive features.
See the Śląskie SMOGSTOP in Action

Get the App Today
Available for Android 8.0 and above